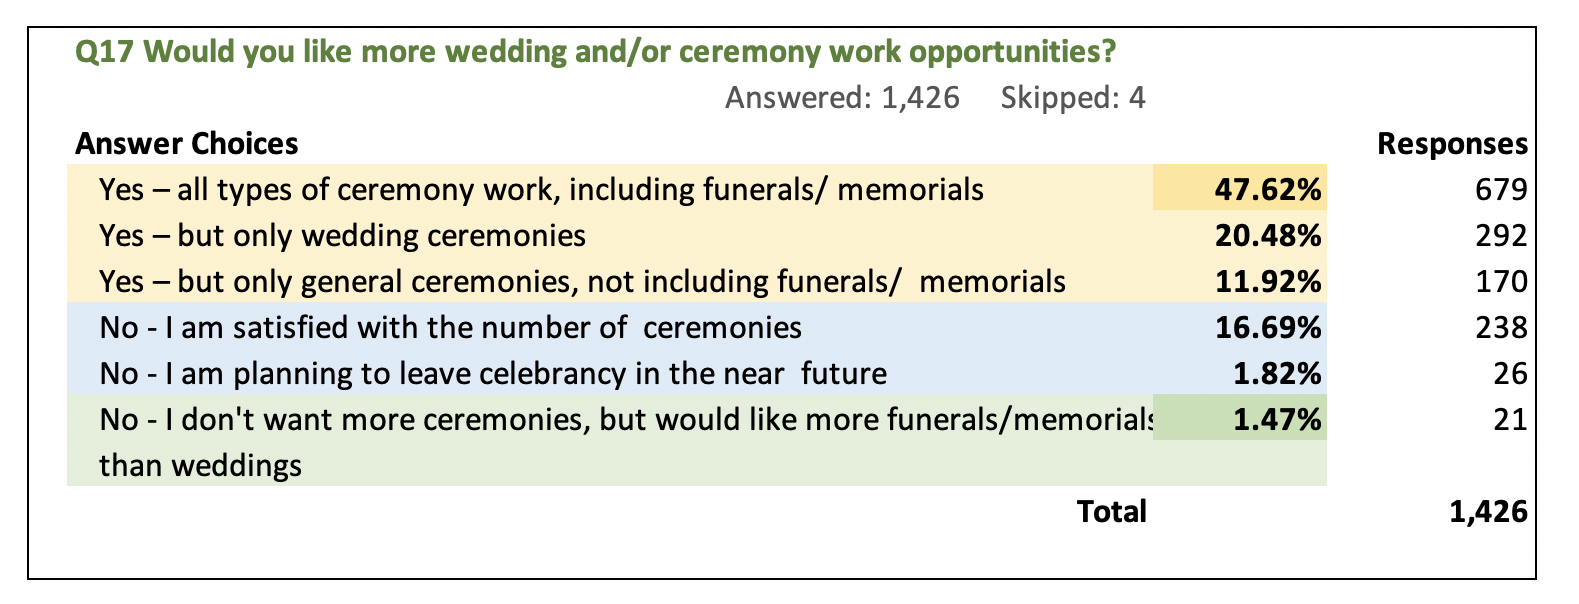
81.5 % of marriage celebrants wanted more ceremonies. Of these celebrants, 47.5 % of wanted all types of ceremony work (including funerals and memorials), 20.5 % of celebrants wanted only wedding ceremonies and 12 % of celebrants wanted more general ceremonies. Some 1.5% of celebrants did not want more weddings, but more funerals/memorials work.
- 18.5 % of celebrants did not want more ceremonies as 16.5 % of celebrants were satisfied with current no of ceremonies and 2 % of celebrants were planning to leave celebrancy in near future
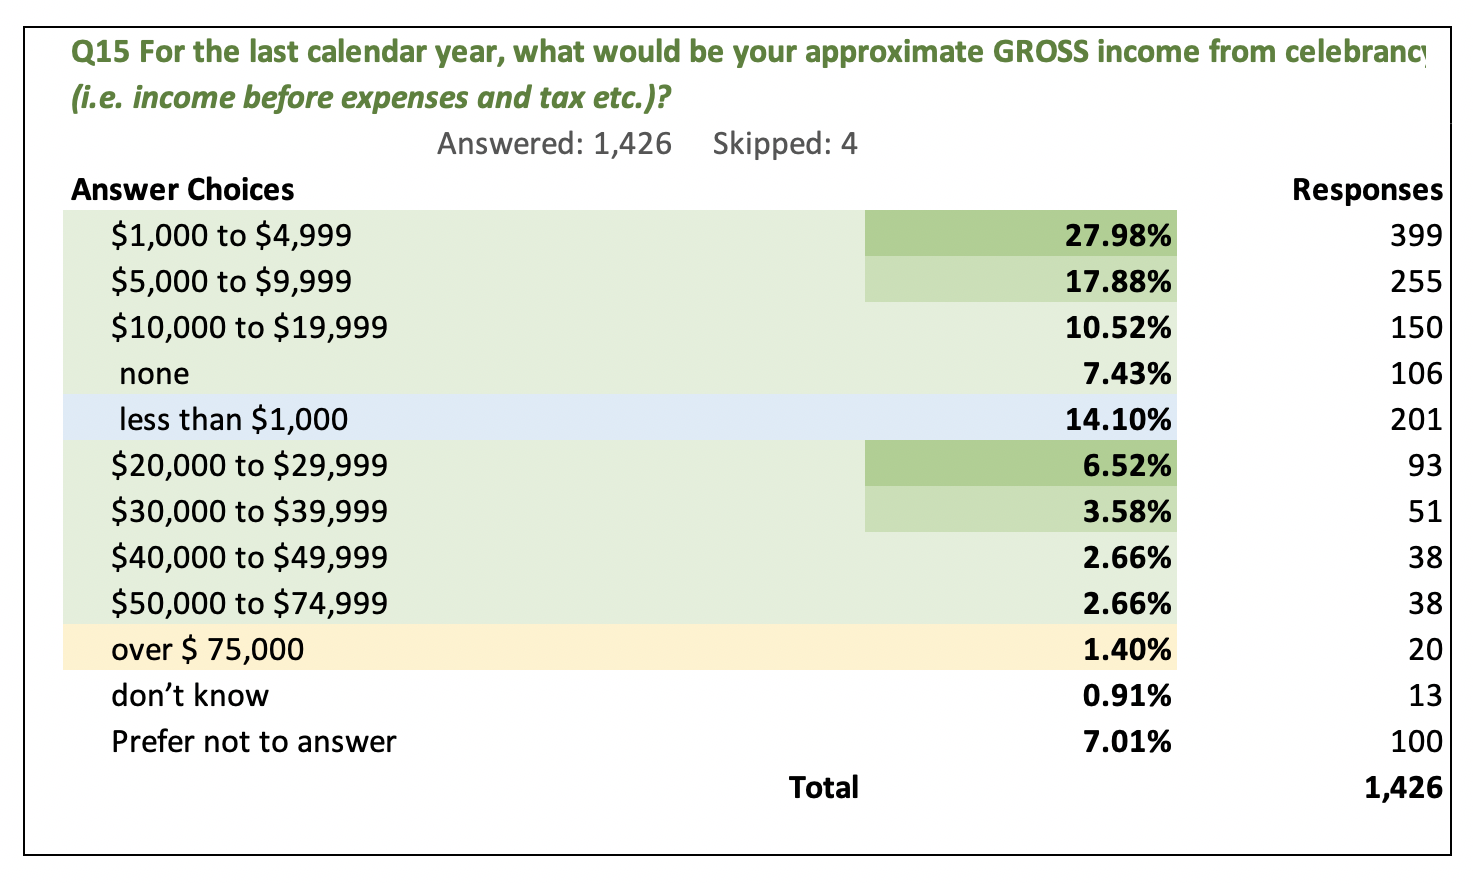
More than three quarters (77.91%) of independent celebrants' income from all ceremonies is less than $20,000 pa gross with more than half (67%) of Celebrants combined income from all ceremonies is less than $10,000 pa gross/ 15.42% of Celebrants combined income from all ceremonies is between $20,000 pa gross and $75,000 pa gross.
- Less than two percent (1.4 %) of marriage celebrants surveyed made over $75,000 pa gross in the previous year. That is, less than 2% made close to average gross wage from all their weddings, funerals and other ceremony work.
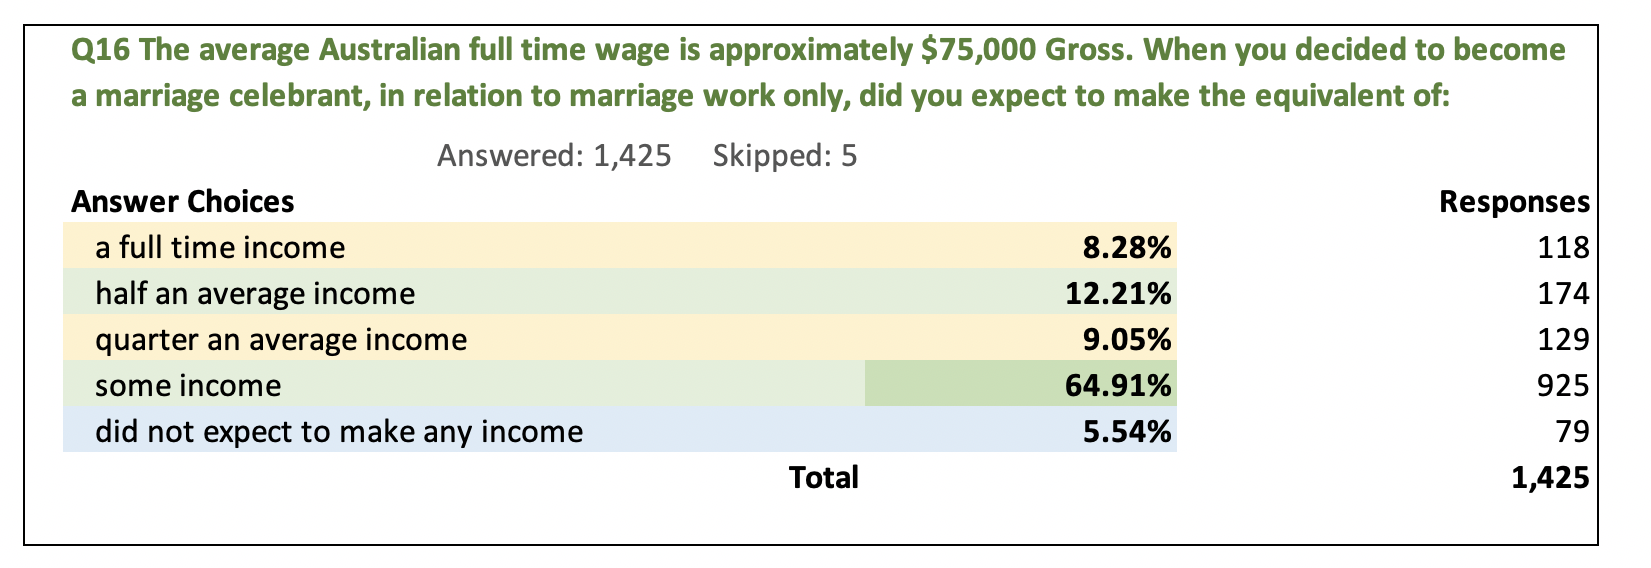
20% of celebrants surveyed expected the equivalent of full-time income or half an average income from only marriage work with 9 % of respondents expected quarter an average income from only marriage work.
- 65 % of respondents expected some income from only marriage work with 5.5 % of respondents did not expect to make any income from only marriage work.
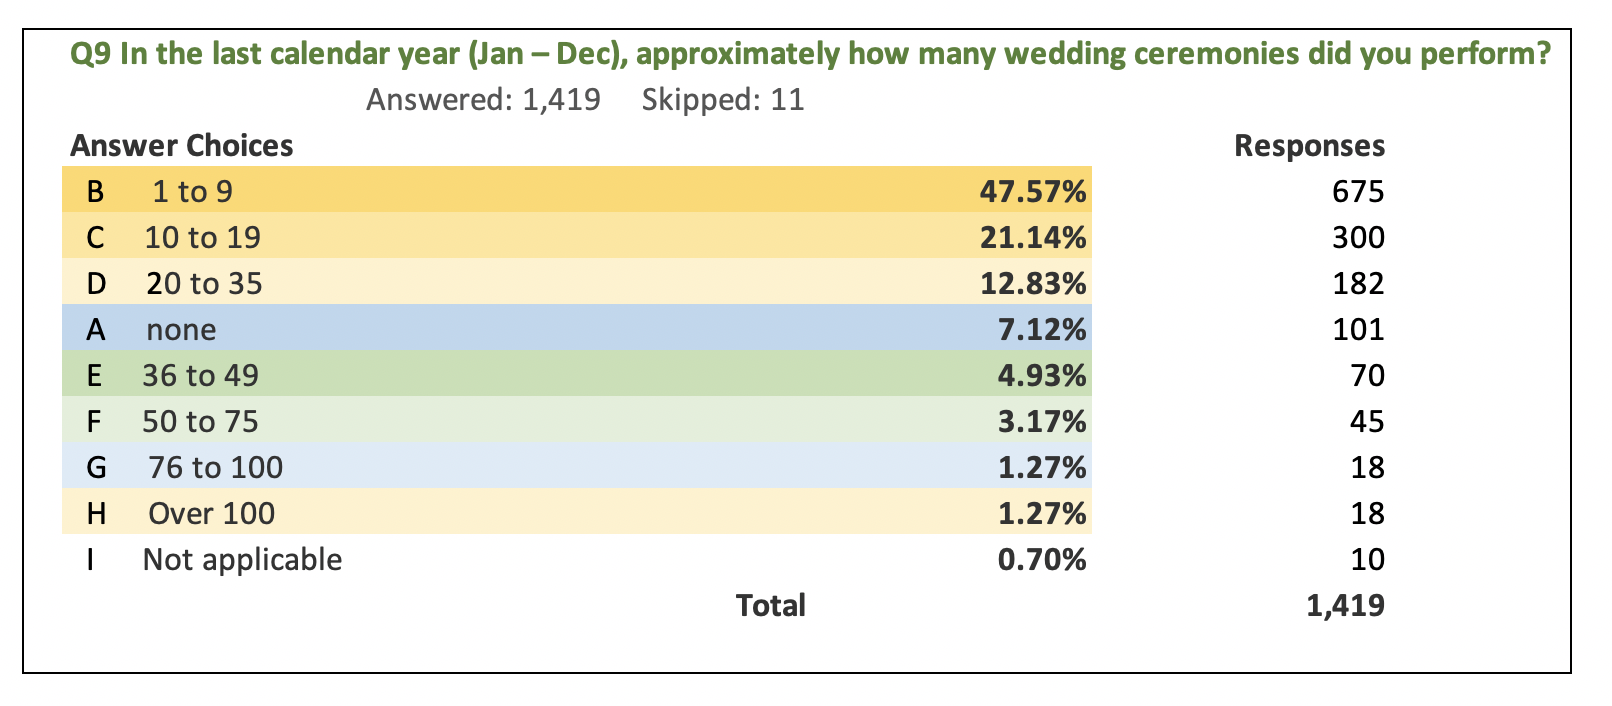
Over 75% of marriage celebrants reported doing less that 20 weddings pa, with 55% of marriage celebrants reported doing nine or less marriages (including 7% who did no marriages in the previous year).
- Less than 2% reported conducting over 100 marriages pa, which is the level at which a marriage celebrant would need to work to do able to make close to an average fulltime wage equivalent (after expenses). About 25% of marriage celebrants reported doing between 20 and 100 weddings in the previous years
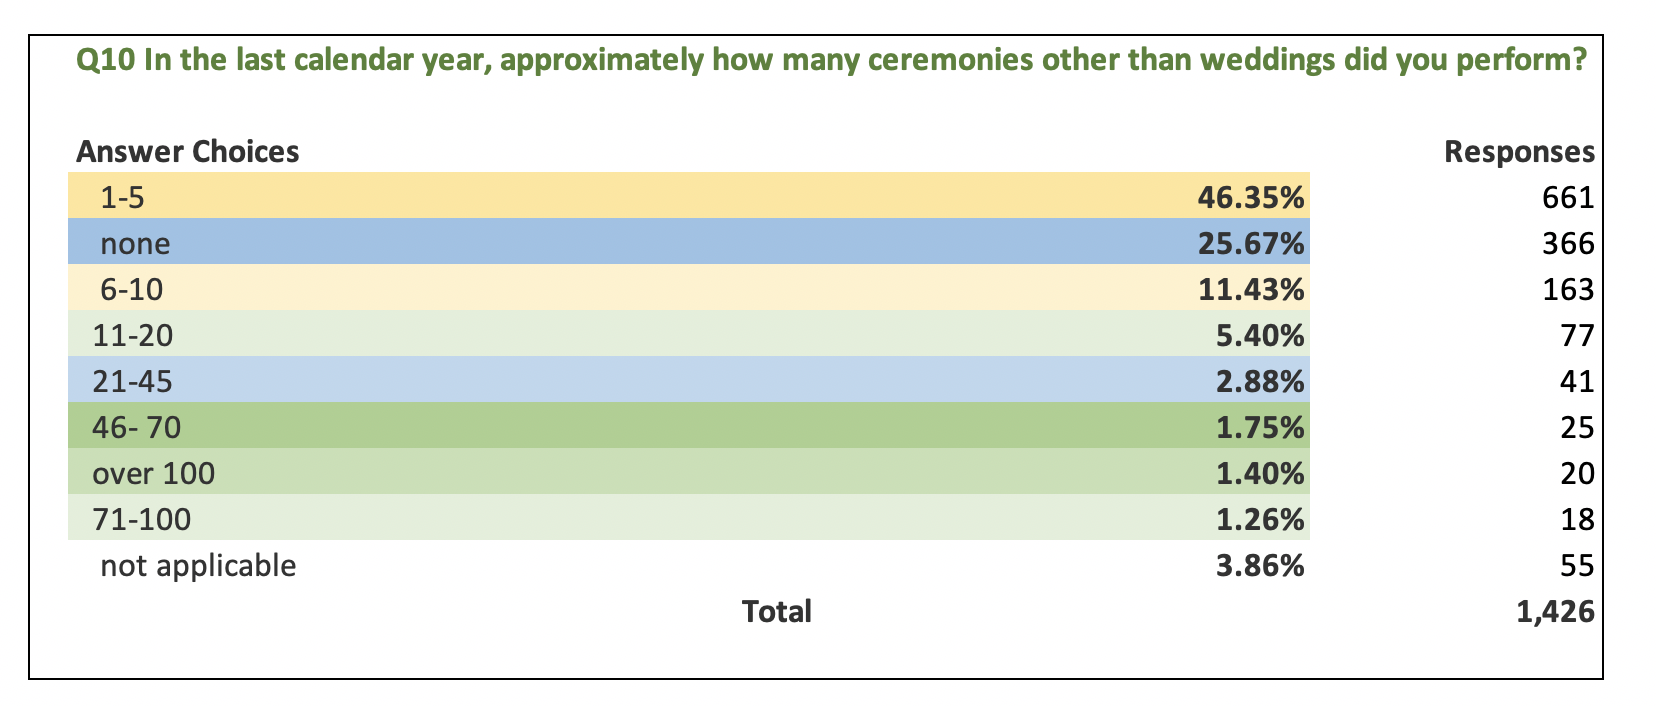
26% of marriage celebrants surveyed reported conducting no other ceremonies in the previous year.
- 46% of celebrants conducted 5 or less other ceremonies in the previous year and a further 22% conducted 6 to 100 other ceremonies in the previous year.
- 1.5% of celebrants surveyed conducted over 100 other ceremonies in the previous year.
88% of celebrant surveyed performed 10 or less ceremonies other than marriage, of which 75% did 5 or less ceremonies other than marriage.
- Less than 10% performed more that 10 ceremonies other than marriage.
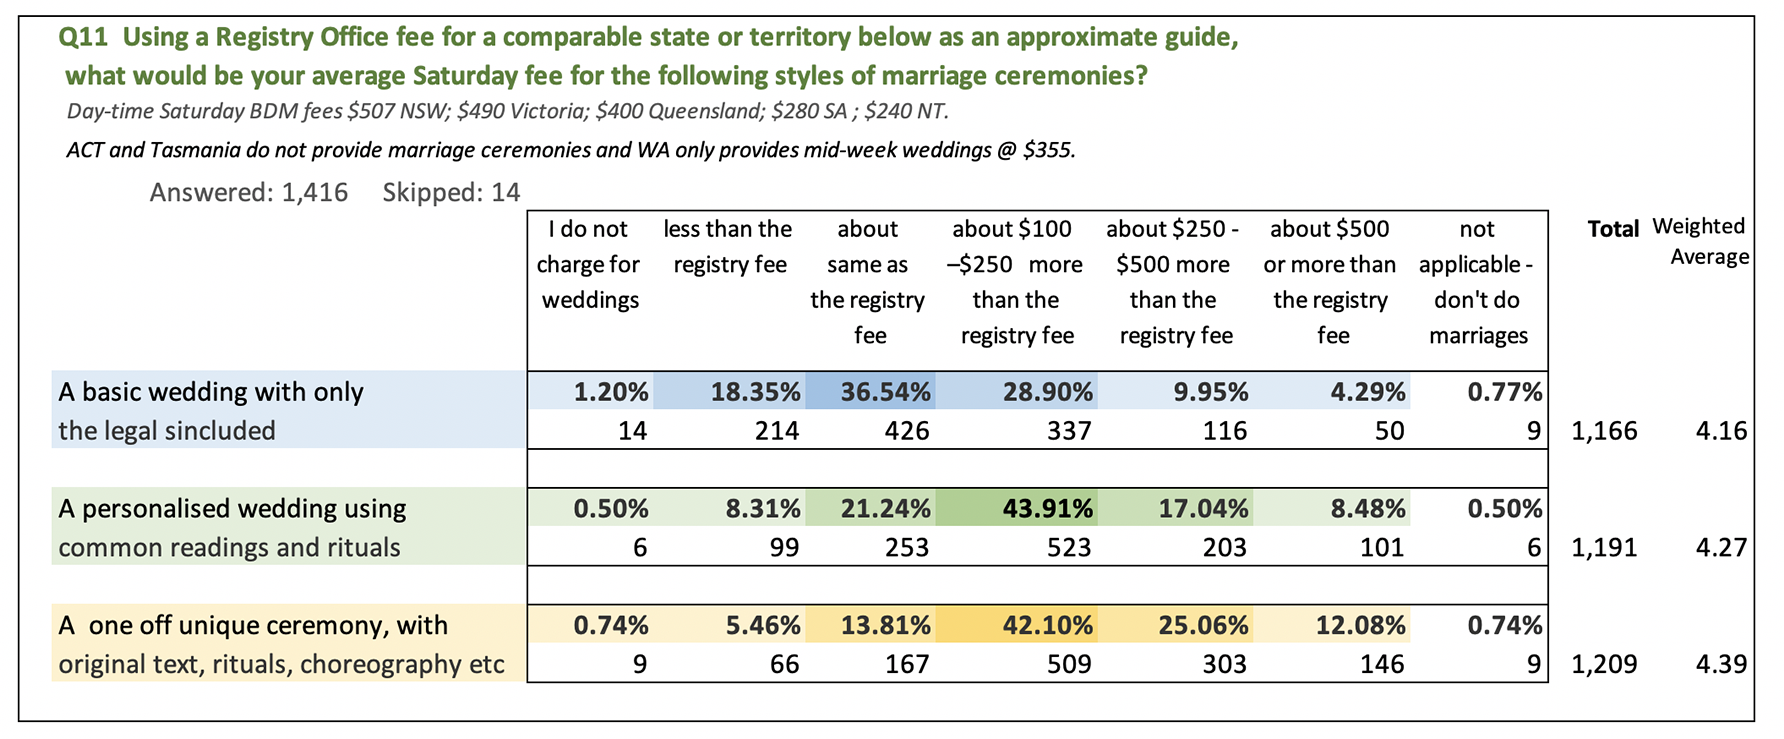
Over 60% to 75% of independent marriage celebrants charged less than or the same as a registery office wedding whether it was a “legals”only", a personalised wedding or a one off/unique wedding ceremony.
- For a personalised wedding, using common readings and rituals, 74% of respondents charged less than or about the same as their registry office.
- For a unique ceremony, with original text, rituals, choreography, 62% of respondents charged less or about the same as their registry office.
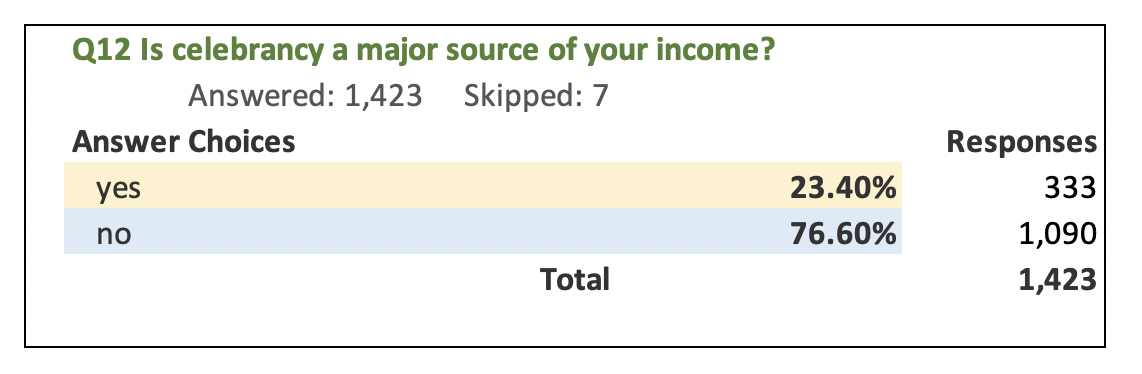
- 23.5% of celebrants noted celebrancy was a major source of their income with 76.5 % of respondents noting celebrancy was not a major source of their income.
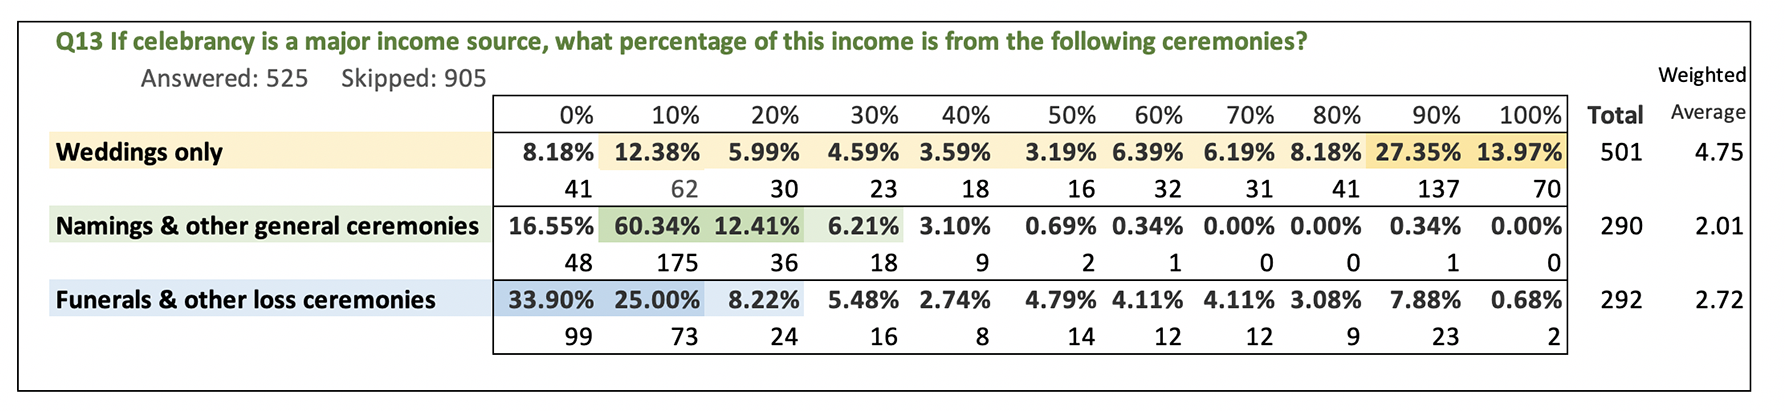
- 41 % of respondents indicated marriage work was 90-100% of their celebrancy income; 14 % of respondents indicated marriage work was 100% of their celebrancy income. 8 % of celebrants indicated they had no celebrancy income in the previous year.
- 34 % of celebrants indicated no celebrancy income from Funerals and Loss ceremonies. Only 8.5 % of celebrants surveyed indicated Funerals and Loss ceremonies work was 90 to 100% of celebrancy income. 56% of celebrants indicated Funerals and Loss ceremonies work was some of their celebrancy income (10 % to 90%).
- 17% of celebrants indicated no celebrancy income from namings and general ceremonies. 60 % of respondents indicated namings and general ceremonies was 10% of their celebrancy income, with a further 17% of celebrants indicated namings and general ceremonies work was less than 40% of their celebrancy income.
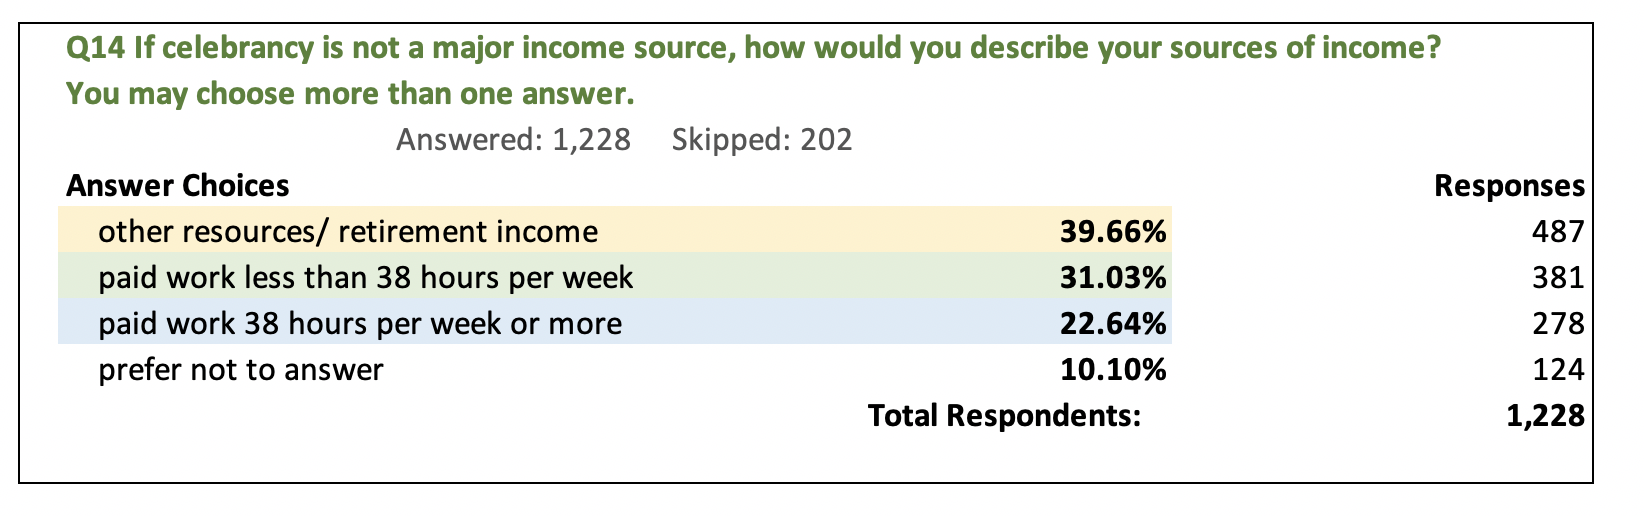
Of those celebrants for whom celebrancy was not a major source of their income
- 37.5% of celebrants had other resources or retirement income
- 30.5% of celebrants had paid work less than 38 hours per week and
- 22% had paid work 38 hours per week or more.
Summary:
Three quarters of all marriage celebrants (75.8%) reported doing less than 20 weddings in the previous year.
More than half of marriage celebrants (55%) reported 9 or less weddings pa - including 7% who reported doing no weddings.
About 25% of marriage celebrants reporting doing between 20 and 100 weddings
1.3 % of marriage celebrants reporting doingover 100 weddings pa
Summary:
26% of marriage celebrants surveyed reportedconducting no other ceremonies in the previous year.
46% of respondents conducted 5 or less other ceremonies in theprevious year.
22%of marriage celebrants surveyed reported conducting 6 to 100conducted other ceremonies in the previous year.
11% ofcelebrants surveyed conducted 6 to 10 other ceremonies in the previousyear.
11% celebrantssurveyed conducted 11 to 100 other ceremonies inthe previous year.
1.4 %of respondents conducted over 100 other ceremonies in the previous year.
Summary:
For a basic wedding with only the legals included
56% of respondents charged less than or about the same as their registry office
A personalised wedding using common readings and rituals
74% of respondents charged less than or about the same as their registry office
One off unique ceremony, with original text, rituals, choreography
62% of respondents charged less or about the same as their registry office
Summary:
23.5% of respondents noted celebrancy was a major source of their income.
76.5 % of respondents noted celebrancy was not a major source of their income.
Summary:
If celebrancy was a major source of their income..
41 % of respondents indicated marriage work was 90-100% of their celebrancy income
14 % of respondents indicated marriage work was 100% of their celebrancy income
8 % of respondents indicated marriage work was 0% of their celebrancy income
60 % of respondents indicated namings and general ceremonies was 10% of their celebrancy income
17% of respondents indicated namings and general ceremonies work was less than 40% of their celebrancy income
17 % of respondents indicated namings & general ceremonies was 0% of their celebrancy income
34 % of respondents indicated Funerals & Loss ceremonies work was 0 % of their celebrancy income
56% of respondents indicated Funerals & Loss ceremonies work was 10 % to 90% of celebrancy income
8.5 % of respondents indicated Funerals & Loss ceremonies work was 90 to 100% of celebrancy income
Summary:
If celebrancy was not a major source of their income
37.5 % of respondents had other resources/ retirement income
22 % of respondents had paid work 38 hours per week or more
30.5 % of respondents had paid work less than 38 hours per week
Summary:
More than three quarters (77.91%) of independent celebrants' income from all ceremonies is less than $20,000 pa gross
More than half (67%) of Celebants combined income from all ceremonies is less than $10,000 pa gross
15.42% of Celebants combined income from all ceremonies is between $20,000 pa gross and $75,000 pa gross
Less than two percent (1.4 %) make over $75,000 pa gross i.e. close to average gross wage from all their weddings, funerals and other ceremony work.
Summary:
20% of respondents expected the equivalent of full time income or half an average income from only marriage work
9 % of respondents expected quarter an average income from only marriage work
65 % of respondents expected some income from only marriage work
5.5 % of respondents did not expect to make any income from only marriage work
Summary:
81.5 % of respondents wanted more ceremonies
47.5 % of respondents wanted all types of ceremony work, inc, funerals/ memorials
20.5 % of respondents wanted only wedding ceremonies
12 % of respondents wanted only more general ceremonies
1.5% of respondents did not want more weddings, but more funerals/memorials
18.5 % of respondents did not want more ceremonies
as 16.5 % of respondents were satisfied with current no of ceremonies
and 2 % of respondents were planning to leave celebrancy in near future