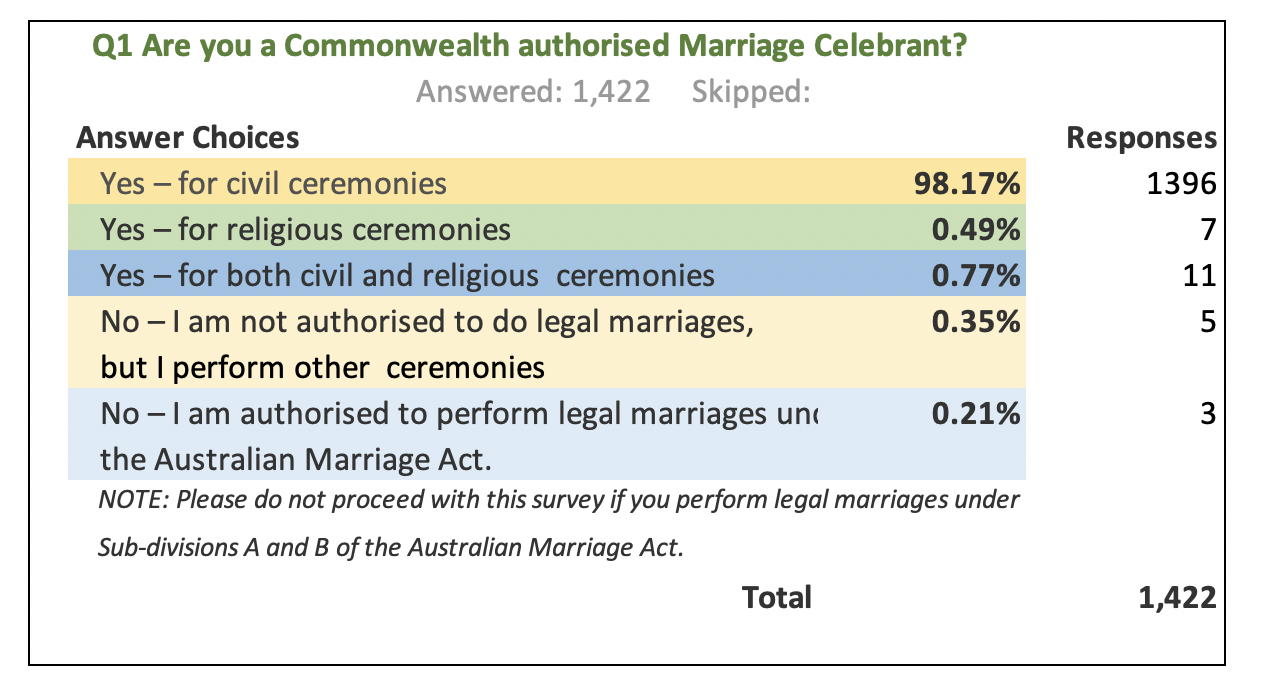
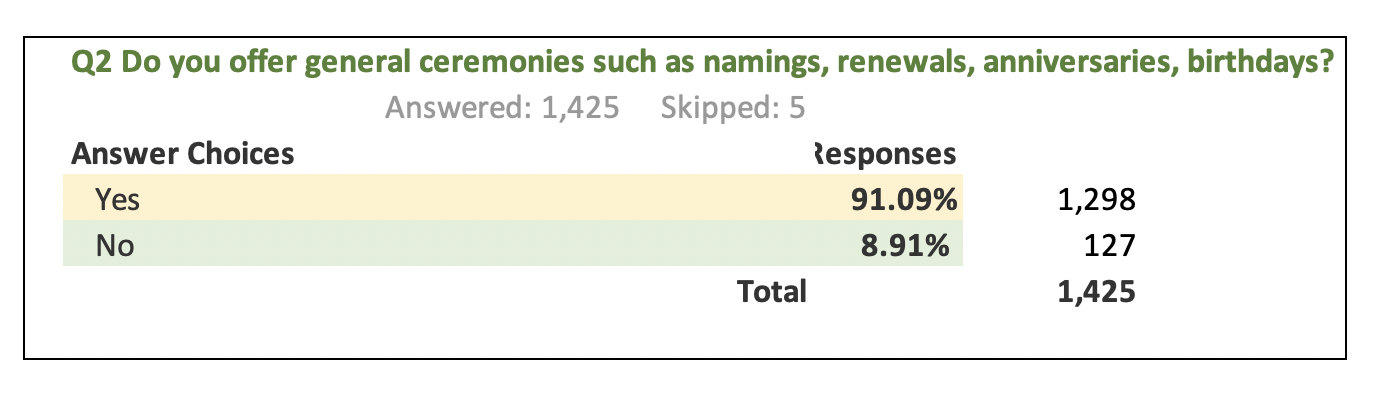
Almost all respondents were (98%) Commonwealth authorised civil marriage celebrants, 90% of which offered other general ceremonies (such as namings, renewals, anniversaries, birthdays)
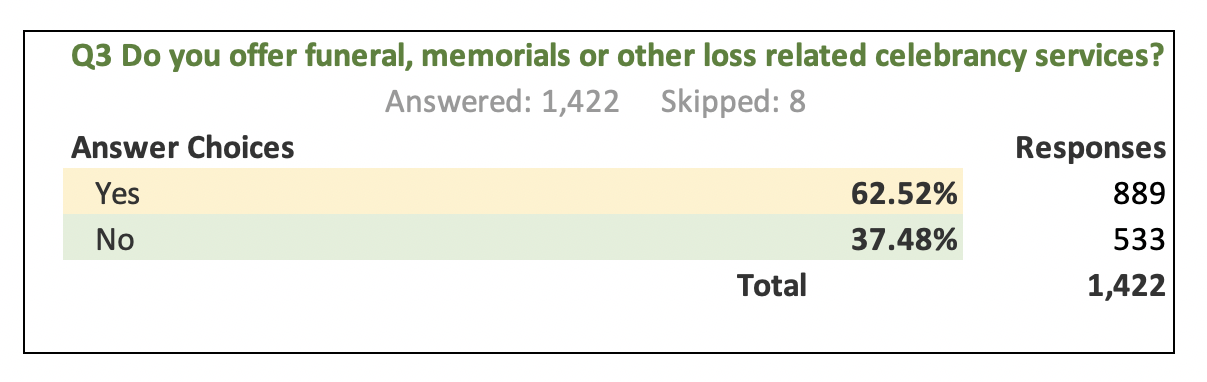
- Over 60% of which offered funeral, memorials or other loss related celebrancy services.
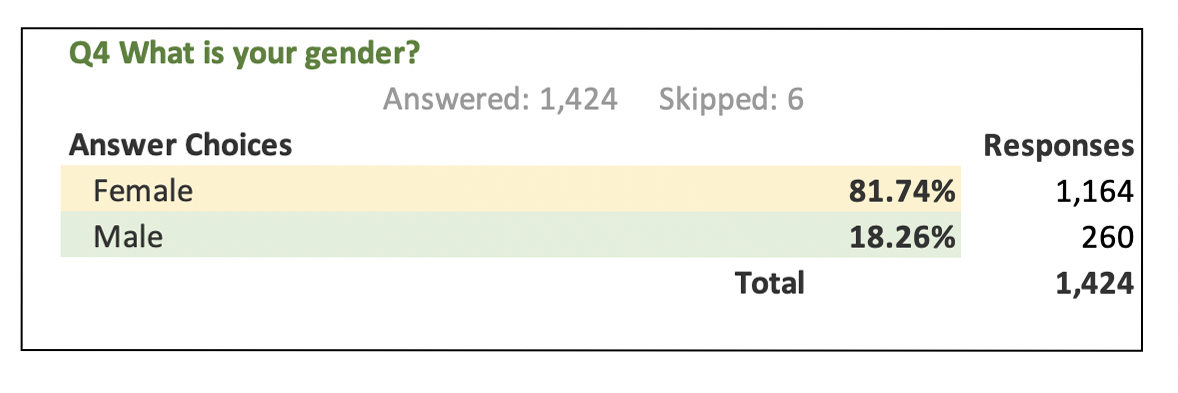
Approximately 80% of these celebrants were female and 20% male.
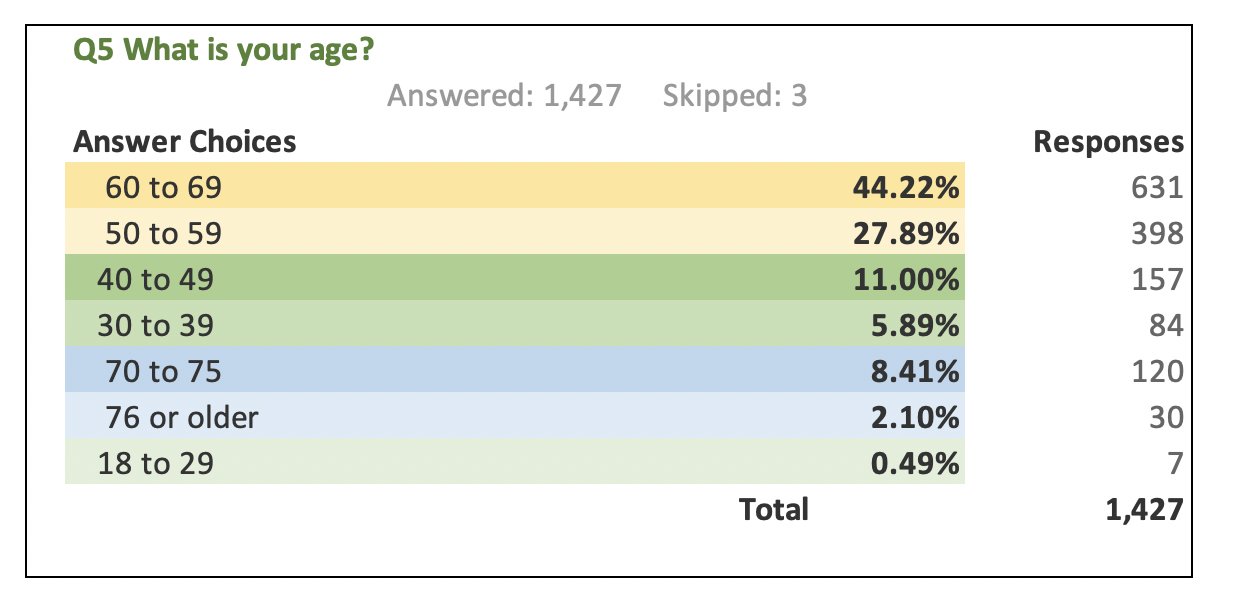
Over 80% of these marriage celebrants were over 50 yearsof age.
- About 55% of these marriage celebrants were over the age of 60 years
- Less than 10% under 40 years of age.
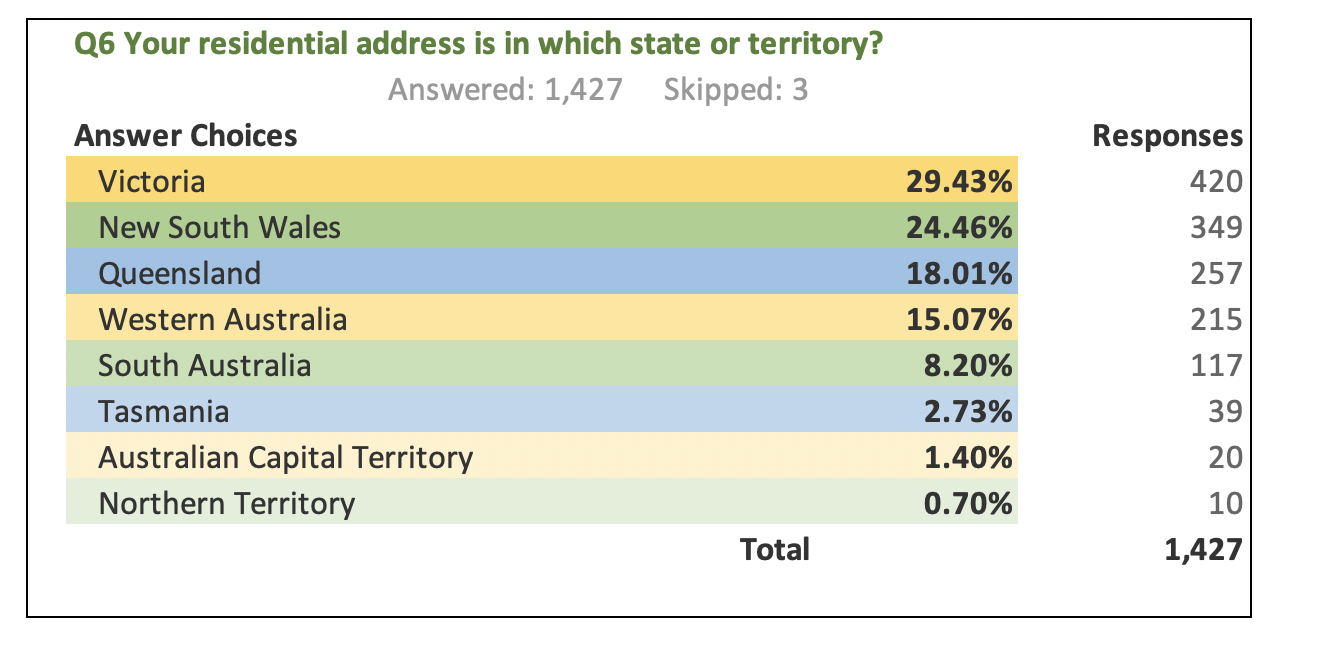
The survey was a reasonably representative sample with respondents in all states and territories, and across a variety of locations – cities, towns, villages and remote areas.
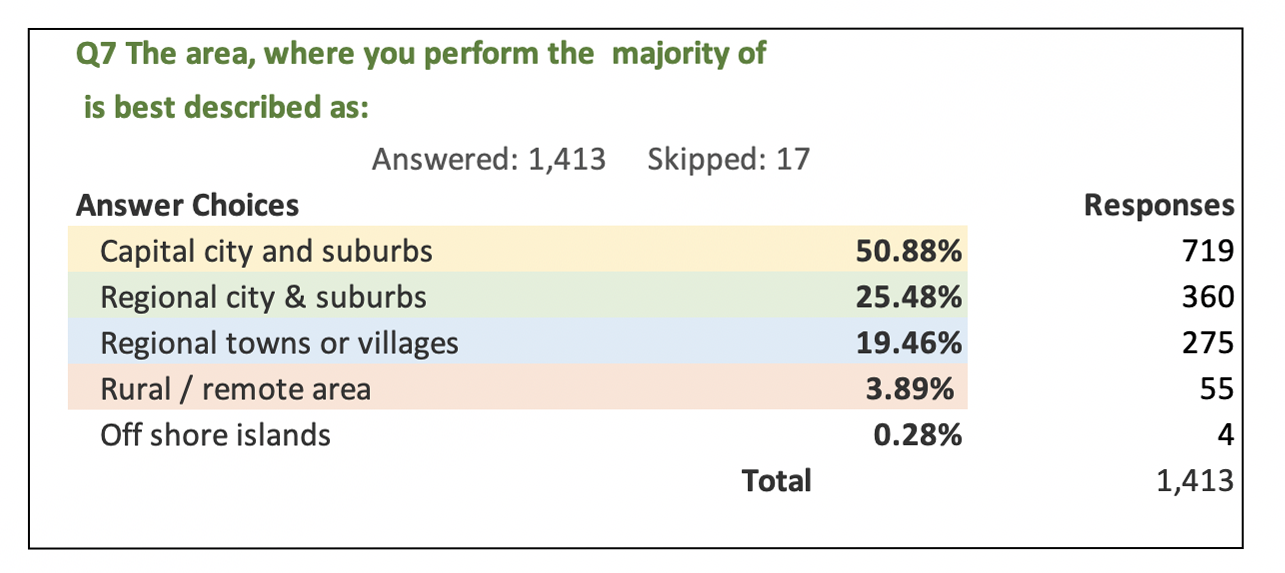
- Half of celebrant respondents were from capital cities and suburbs, 26% from regional cities and suburbs with the remainder of celebrant respondents 23% from regional towns, villages and remote areas.
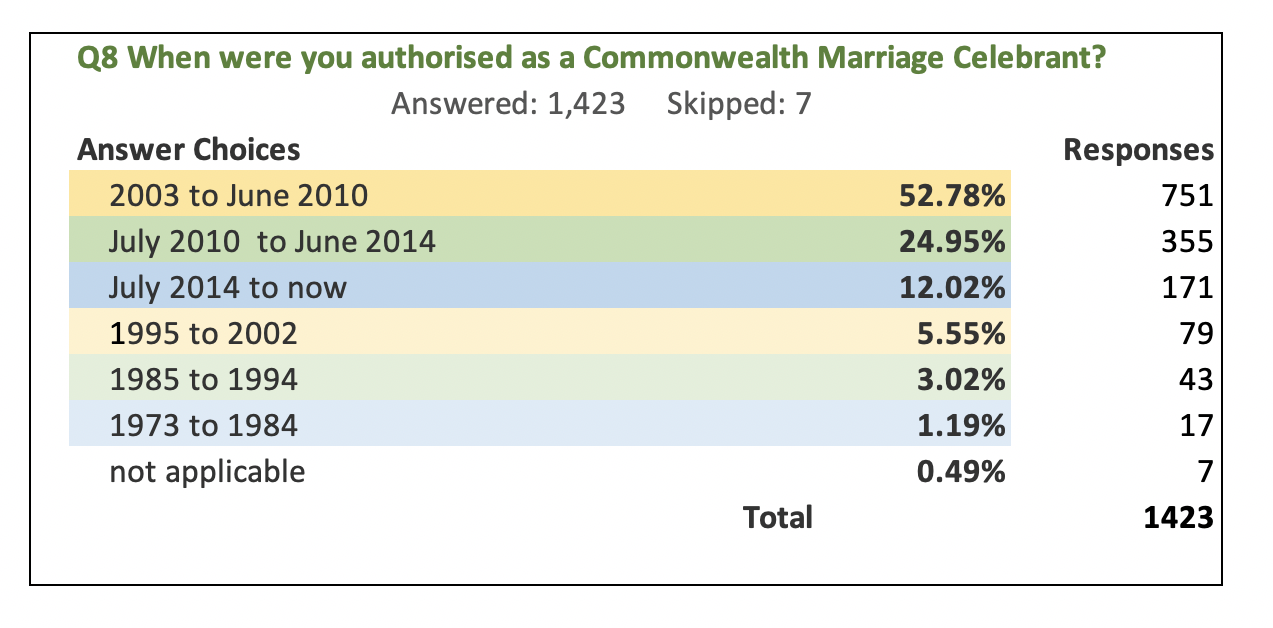
Over 50% of marriage celebrant surveyed were authorised between 2003 and 2010 when only one unit of the VET Certificate IV in Marriage Celebrancy was the entry criteria.
- A further 37% have authorised with the full Certificate IV in Celebrancy as the authorisation requirement.
- Less than 10% of marriage celebrants were authorised prior to the 2003 changes to the Marriage Act.
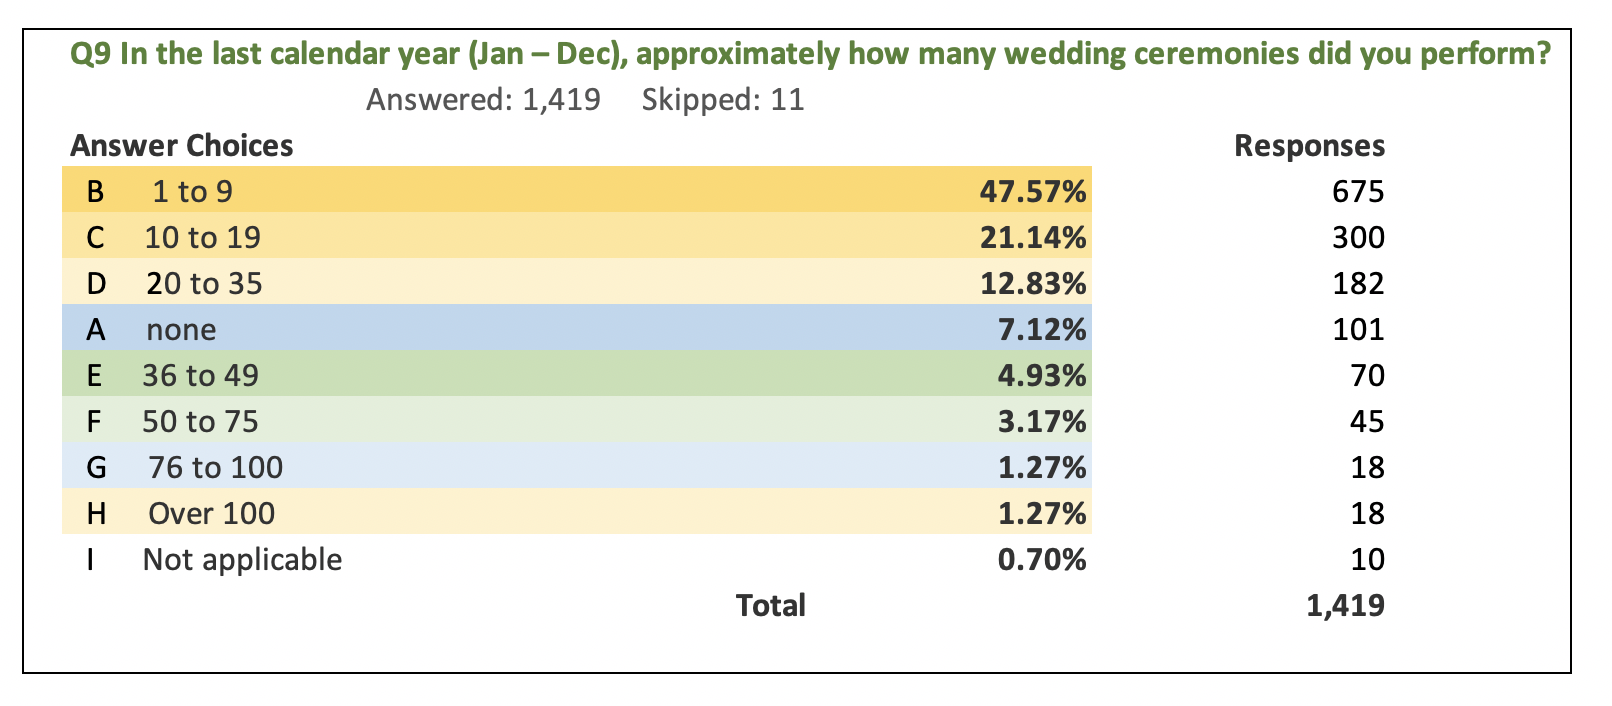
Over 75% of marriage celebrants reported doing less that 20 weddings pa, with 55% of marriage celebrants reported doing nine or less marriages (including 7% no marriages).
- Only approximately 2% reported conducting over 100 marriages pa, which is the level at which a marriage celebrant would need to work to do able to make close to an average fulltime wage equivalent (after expenses).
Summary:
99.5% of respondents were authorised marriage celebrants.
 Summary:
91% offer general ceremonies such as namings, renewals, anniversaries, birthdays.
Summary:
63% offer funeral, memorials or other loss related celebrancy services.
Summary:
82 % of respondents were female
18% of respondents were female.
Summary:
6.38% of marriage celebrants respondents were under 40
11% of marriage celebrants respondents were between 40 and 50
82.62% of marriage celebrants respondents were over 50
Summary:
87% of respondents reside in Victoria, New South Wales, Queensland and Western Australia
29.5 % of respondents reside in Victoria (compares with 25.2% Vic population)
24.5 % of respondents reside in New South Wales (compares with 32.0% NSW population)
18 % of respondents reside in Queensland (compares with 20.1% QLD population)
15 % of respondents reside in Western Australia (compares with 10.8% WA population)
13% of respondents reside in South Australia, Tasmania, ACT and Northern Territory
8.2 % of respondents reside in South Australia (compares with 7.1% SA population)
2.7 % of respondents reside in Tasmania (compares with 2.2% TAS population)
1.4 % of respondents reside in ACT (compares with 1.6 % ACT population
0.7 % of respondents reside in Northern Territory (compares with 1.0% NT population)
Summary:
50.7 % of respondents perform the majority of ceremonies in Capital city and suburbs
50.5 % of respondents perform the majority of ceremonies in Regional city & suburbs or Regional towns or villages
4.3 % of respondents perform the majority of ceremonies in Rural / remote area or Off shore islands
 Summary:
Note: F&P = Fit and proper persons; COI/B2B = Conflict of Interest/ Business to Business
10% authorised between 1973 and end 1995
1.2% of respondents between 1973 to 1984 (public speaking exp., community volunteer; F&P; no COI/ B2B*)
3% of respondents between 1985 to 1994 (* as above plus age over 35?)
5.5% of respondents authorised between 1995 to 2002 (* as above plus fee deregulated)
53% of respondents authorised between 2003 to June 2010 (One unit of Cert IV in Marriage Celebrancy + F&P)
25% of respondents between July 2010 to June 2014 (Cert IV in Celebrancy + F&P)
12 % of respondents between July 2014 to June 2016 (Cert IV in Celebrancy + F&P)
37% after June 2010 authorised after June 2010
0.5% not applicable
Summary:
Three quarters of all marriage celebrants (75.8%) reported doing less than 20 weddings in the previous year.
More than half of marriage celebrants (55%) reported 9 or less weddings pa - including 7% who reported doing no weddings.
About 25% of marriage celebrants reporting doing between 20 and 100 weddings
1.3 % of marriage celebrants reporting doingover 100 weddings pa