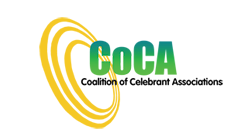
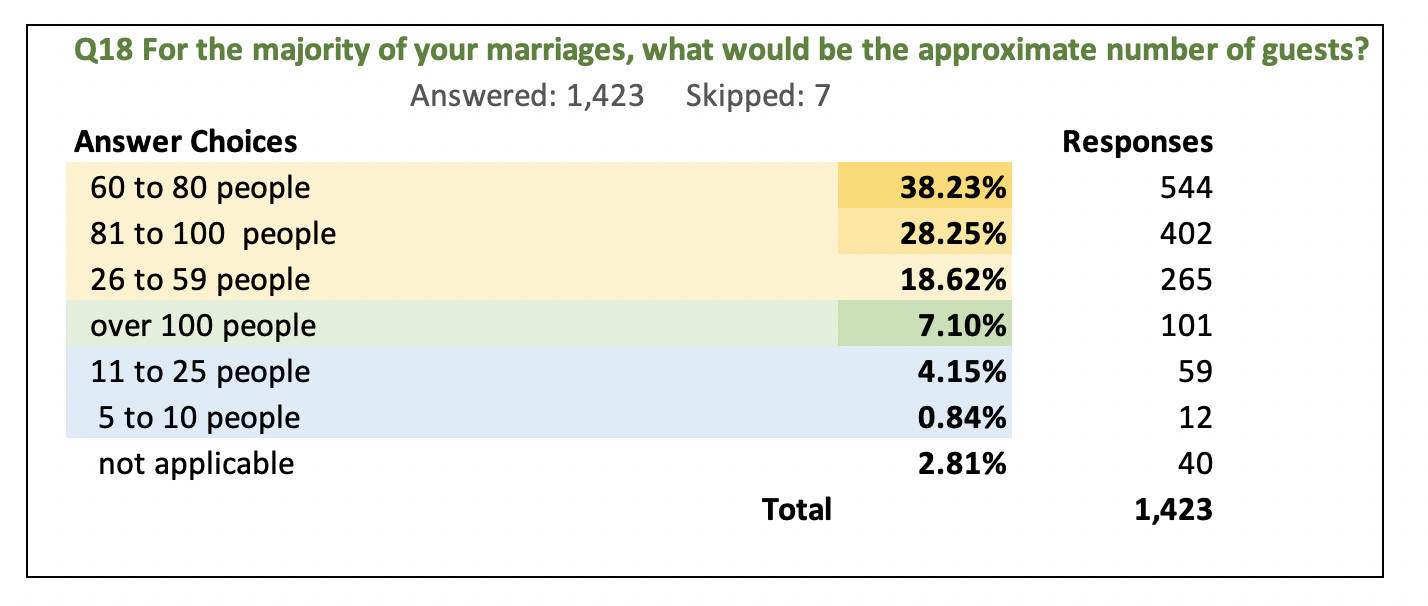
Independent celebrants celebrated marriages where over 90% percentage of marriage ceremonies and over 65% of other ceremonies had more than 25 quests
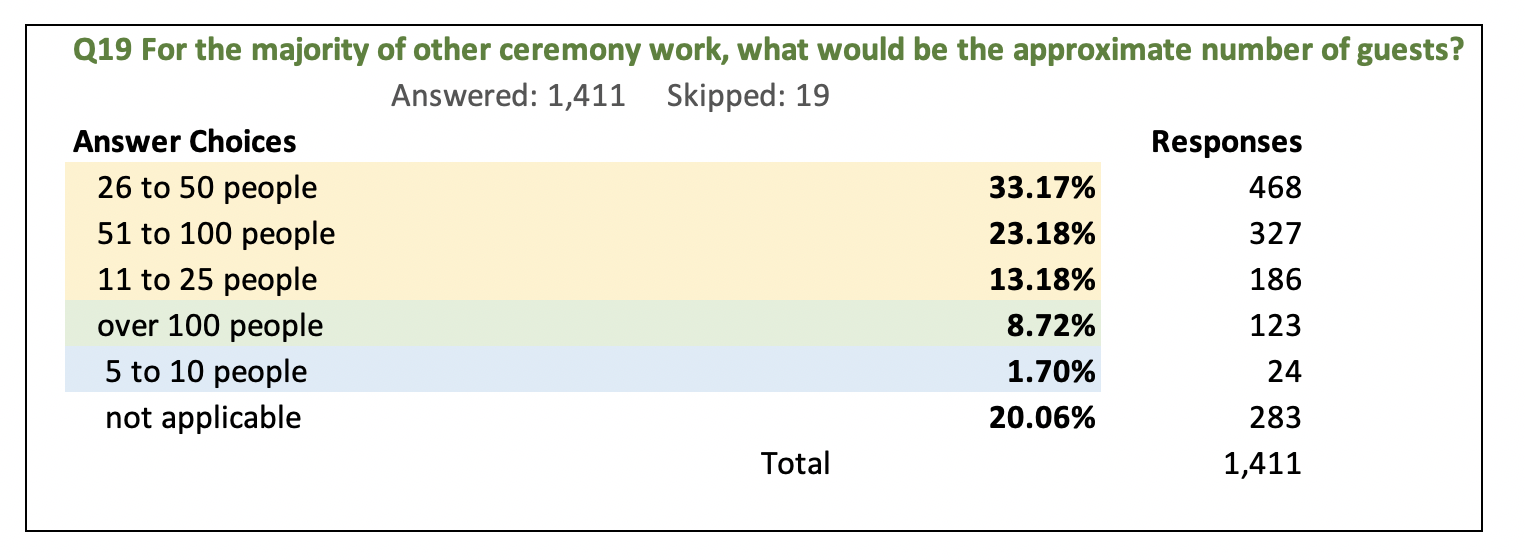
The majority of couples married by surveyed celebrants were residents of Australia.
- The remaining couples were residents of Australia, who had married overseas, and were then wanting a second Australian wedding ceremony
- Non-residents of Australia arriving from overseas for destination wedding.
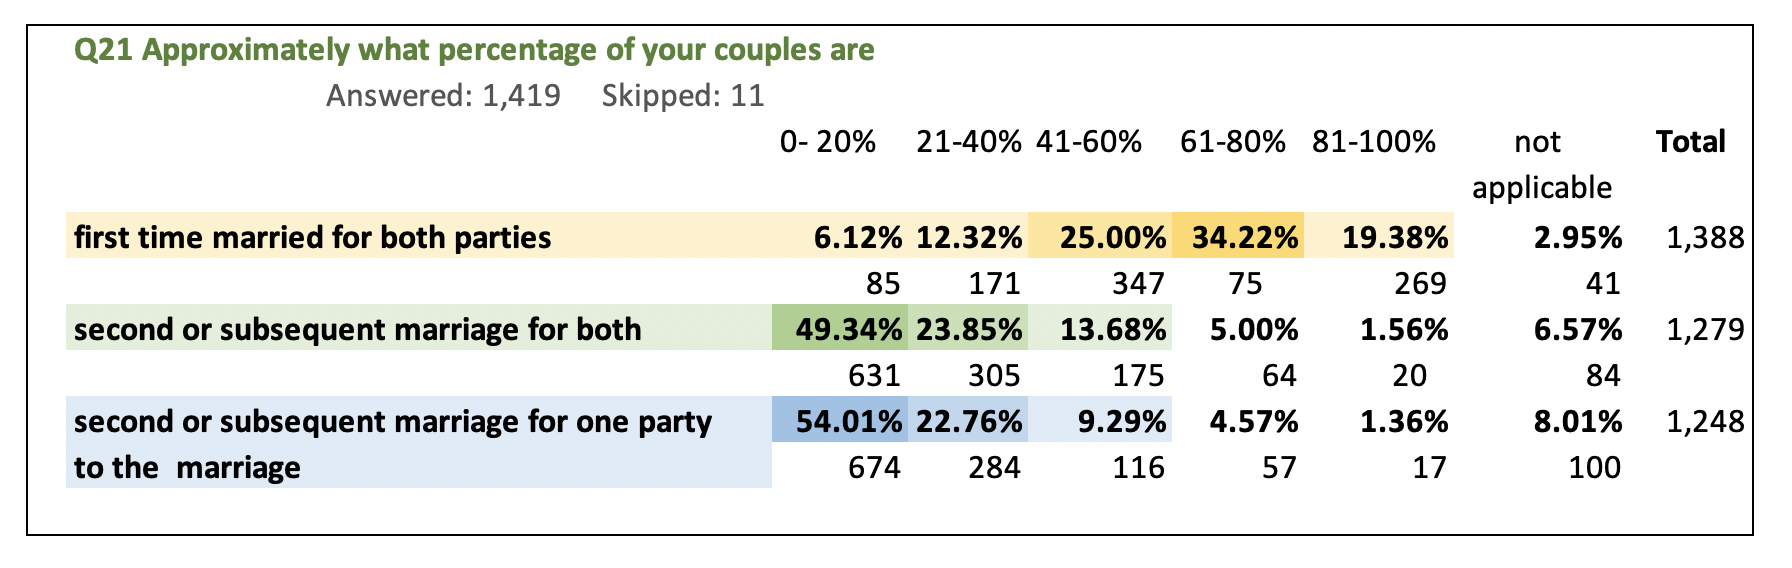
Between 80-100% of respondents' couples were marrying for the first time for both parties, with the remaining couples married by respondents divided between
- couples where it was a second or subsequent marriage second for one party to the marriage, or where it was a second or subsequent marriage for both parties to the marriage, with the latter slightly less common than the former.
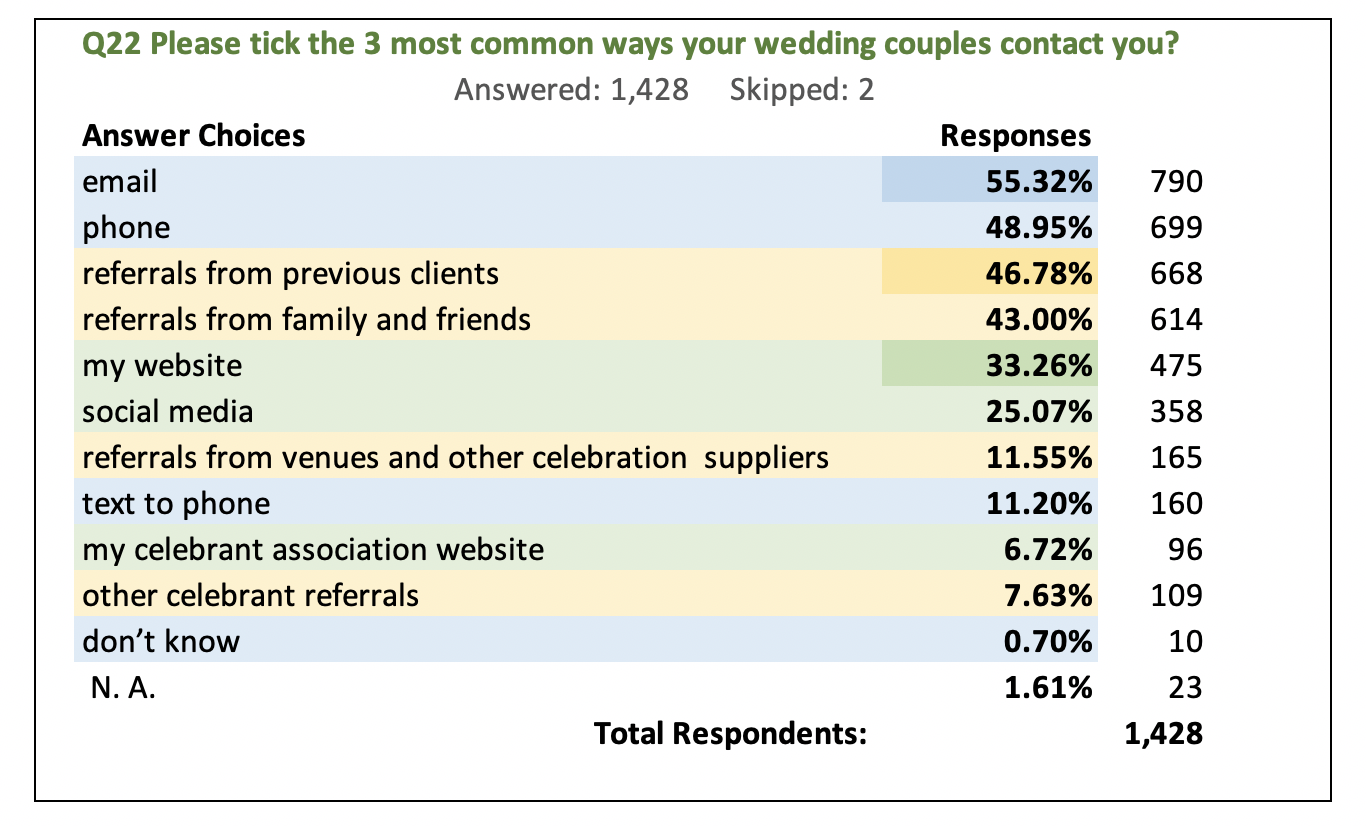
When combining the types of referrals into three major categories: 40% of referrals were from by traditional media - phone, email or text to phone; 38% are by word of mouth referrals and 23% are from celebrant's own website, celebrant association website or from social media.
- Given that the contacts from phone, text or email are a secondary source (i.e. require the celebrant’s number or email being found somewhere) this means 63% from word of mouth referral and 37% from newer technologies.
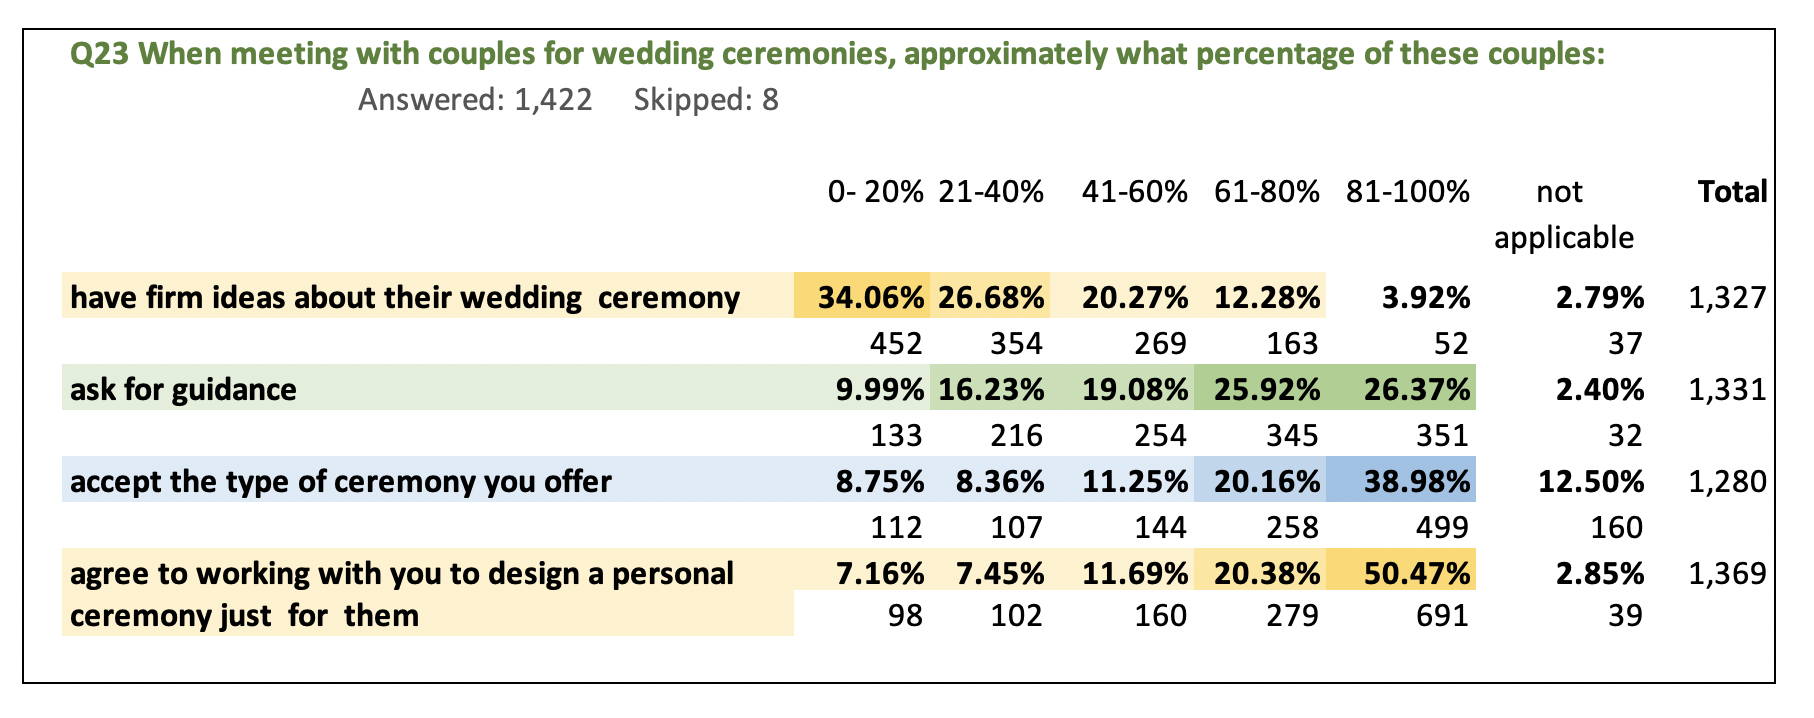
In preparing marriage ceremonies, about half of all couples (50%) agree to working with the celebrant to design a personal ceremony just for them, and about forty percent (40%) of couples accept the type of ceremony the celebrant offers.
- Celebrants report less than 3% of couples have firm ideas about their ceremonies, and one quarter (25%) of couples ask for guidance.
Summary:
Over ninety (92.2%) percentage of marriage ceremonies had more than 25 quests
Summary:
Over sixty percentage (65.1%) of other ceremonies had more than 25 quests
Summary:
96% of couples married by respondents were residents of Australia
The remaining couples married by respondents were 50:50 between couples where
- residents of Australia had married overseas then wanting a second Australian wedding ceremony and
- non-residents of Australia arriving from overseas for destination weddings
Summary:
Between 80-100% of respondents' couples were marrying for first time for both parties
The remaining couples married by respondents where divided between couples where
• it was a second or subsequent marriage second for one party to the marriage or
• a second or subsequent marriage for both parties to the marriage
where the latter was slightly less common than the former (54:46)
Summary:
When combining the types of referrals into three major categories:
40% were from by traditional media- phone, text to phone or
38% were by word of mouth referrals
23% were from celebrant's own website, celebrant association website or from social media.
Given that the contacts from phone, text or email are a secondary source (ie require the celebrant’s number or email being found somewhere)
this means
- 63% from word of mouth referral and
- 37% from newer technologies.
Summary:
About half of all couples agree to working with the celebrant to design a personal ceremony just for them
About forty percent (38.98%) of couples accept the type of ceremony the celebrant offers
Less than 3% (2.8%) of couples have firm ideas about their ceremonies
About one quarter (26.4%) of couples ask for guidance